| Previous Tutorial | Tutorial 6 | Next Tutorial | ||
| STM32 Debugging With ST-Link v2 SWD | Serial Wire Viewer | ||||
| STM32 Course Home Page ???? |

In this tutorial, we’ll discuss how to debug your projects using the ST-Link debugger SWD and the Serial Wire Viewer (SWV) mode. How to open it and print data to the serial wire console within the IDE itself. We’ll also set up breakpoints to stop the MCU at some points in the code to check live variables while the MCU is running your firmware.
[toc]
All the example code/LABs/projects in the course are going to be done using those boards below.
| QTY | Component Name | ???? Amazon.com | ???? eBay.com |
| 2 | BreadBoard | Amazon | eBay |
| 1 | LEDs Kit | Amazon Amazon | eBay |
| 1 | Resistors Kit | Amazon Amazon | eBay |
| 1 | Capacitors Kit | Amazon Amazon | eBay & eBay |
| 2 | Jumper Wires Pack | Amazon Amazon | eBay & eBay |
| 1 | 9v Battery or DC Power Supply | Amazon Amazon Amazon | eBay |
| 1 | Micro USB Cable | Amazon | eBay |
| 1 | Push Buttons | Amazon Amazon | eBay |
★ Check The Full Course Complete Kit List
Some Extremely Useful Test Equipment For Troubleshooting:
Affiliate Disclosure: When you click on links in this section and make a purchase, this can result in this site earning a commission. Affiliate programs and affiliations include, but are not limited to, the eBay Partner Network (EPN) and Amazon.com.
The ARM Cortex®-M3 & M4 core contains hardware extensions for advanced debugging features. The debug extensions allow the core to be stopped either on a given instruction fetch (breakpoint) or data access (watchpoint). When stopped, the core’s internal state and the system’s external state may be examined. Once the examination is complete, the core and the system may be restored and program execution resumed.
The debug features are used by the debugger host when connecting to and debugging the STM32 MCUs.
Two interfaces for debugging are available:
The debug features embedded in the Cortex®-M3 core are a subset of the Arm® CoreSight Design Kit.
We’ll be using the SWD in this tutorial. Down below is a diagram for the ARM Cortex-M3 debugging support hardware. Which includes the ITM for the serial wire trace debugging, and extra more features.
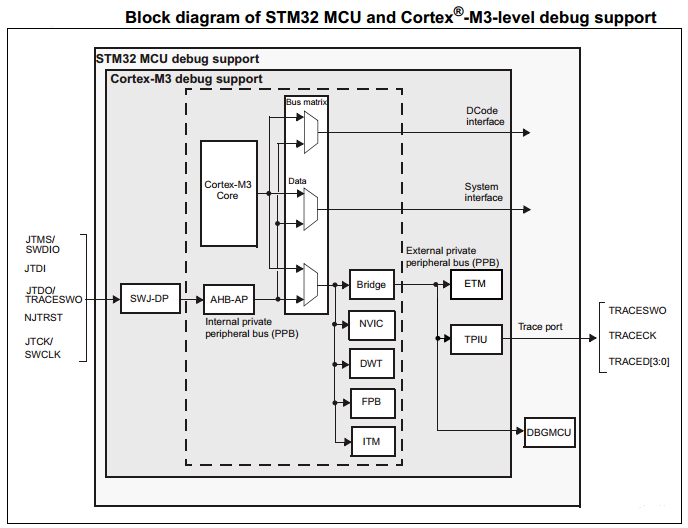
The Arm® Cortex®-M3 core provides integrated on-chip debug support. It is comprised of:
For Debugging Projects With The Blue Pill Board
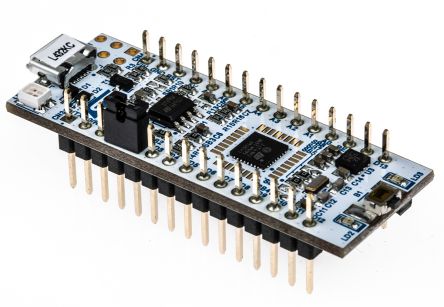
This is the tool you need. Unfortunately, the Chinese clone on the left doesn’t support the serial wire trace debugging as it is. Because it doesn’t expose the SWO pin to its pinout. So you’ll need the original kit on the right, and the SWO pin will be connected to pin B3 of the blue pill.
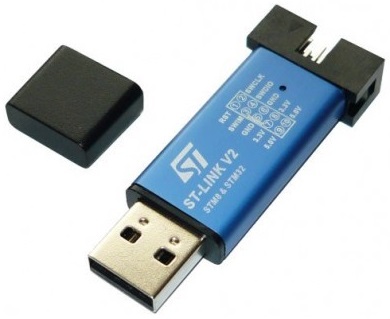 | 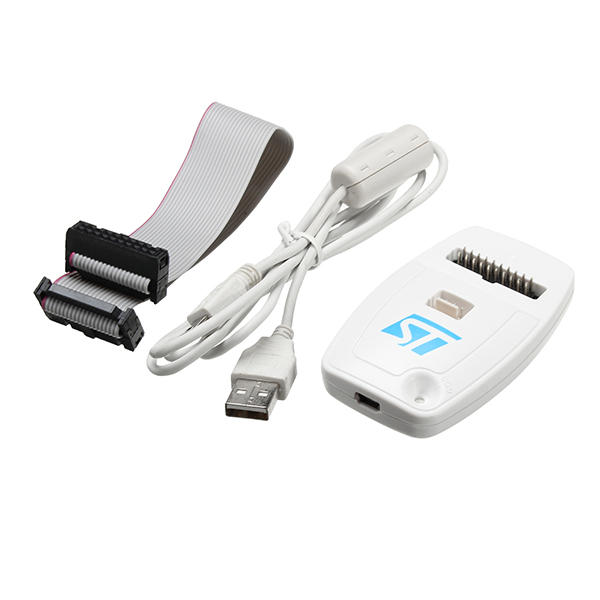 |
Alternatively, there is a hack for the ST-Link v2 USB Clone (the one on the left). So you can solder the SWO pin out to any pin on the header. Typically we’re using only 4 out of the 10pins. So you can route the SWO pin out to any other pin. As shown in this article.
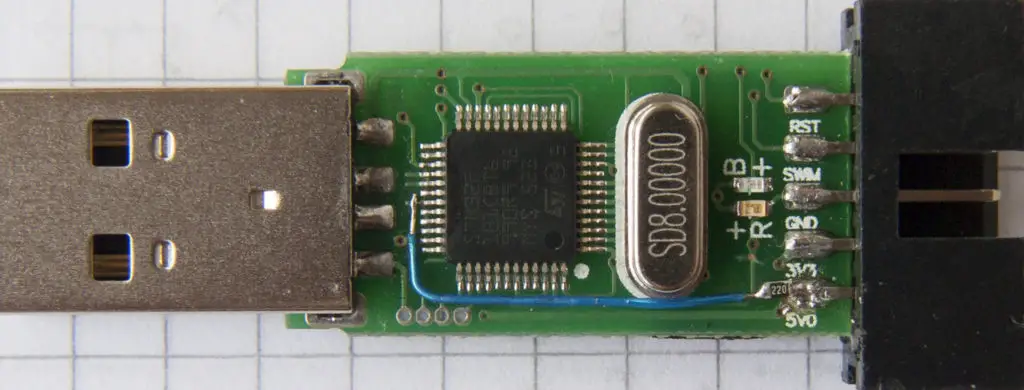 5V pin converted into SWO
While configuring the SWD debugging feature in CubeMX, you’ll notice that the SWO pin is B3. Which you’ll need to connect to ST-Link debugger. The steps for SWD debugging are going to be the same regardless of the target microcontroller.
For Debugging With Nucleo Boards (Nucleo32-L432KC)
Nucleo boards come equipped with an integrated ST-Link v2 programmer/debugger chip. It’s another microcontroller on the board itself. In the case of our Nucleo32L432KC, it’s a small microcontroller on the back of the board. It’s hooked up to the USB port on the board. It gives you full debugging capability while flashing the code easily to the board. It even gets detected as a storage device, so you can just drag and drop the binary file (hex code) to the chip directly and it’s been flashed already without any clicks!
 The Target Microcontroller STM32L432KC On The Top Side OF The Board
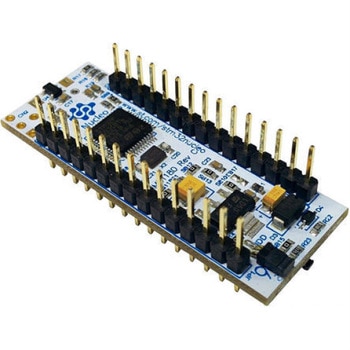 The ST-Link v2 Programmer / Debugger On The Bottom Side OF The Board. It’s The One Connected To The USB Port On The Board As Well.
Obviously, no extra hardware is needed when you’re using Nucleo Boards. And the debugging steps are the same for all Nucleo boards and the blue pill with ST-Link v2. However, the Nucleo32 boards (the 32-pins small version) like the shown above, doesn’t have the SWO pin connected to the integrated ST-Link debugger.
You’ll have to solder a bridge wire across the board with the help of the board schematic to enable this serial wire trace feature. And I won’t do this. I’ll give you the steps to debug with the serial wire viewer just in case you could hack your ST-Link clone or you have a discovery board or a Nucleo-64 maybe that doesn’t lack the connection for the SWO pin.
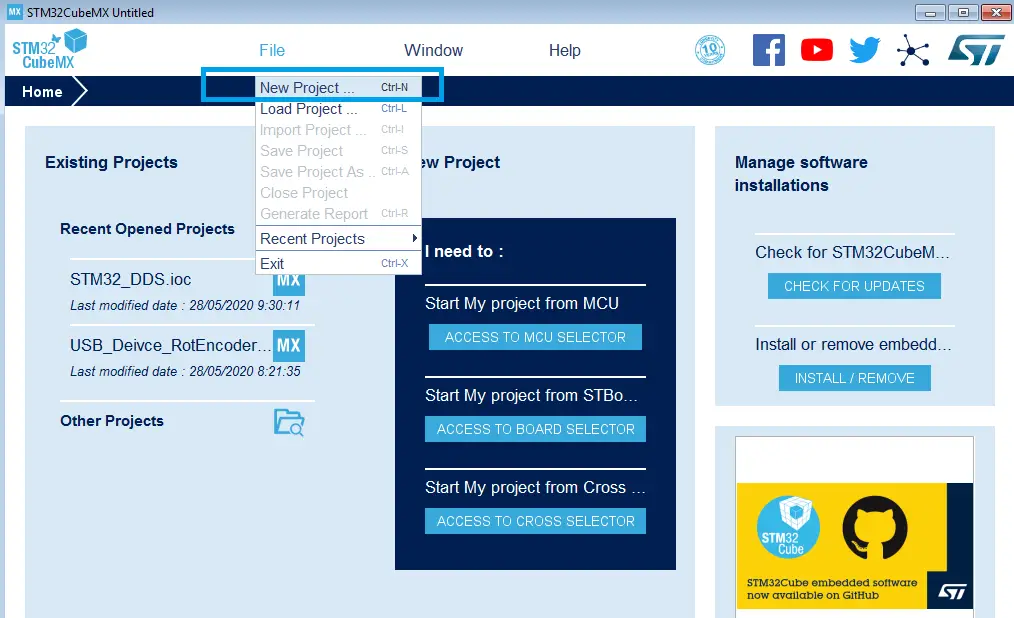
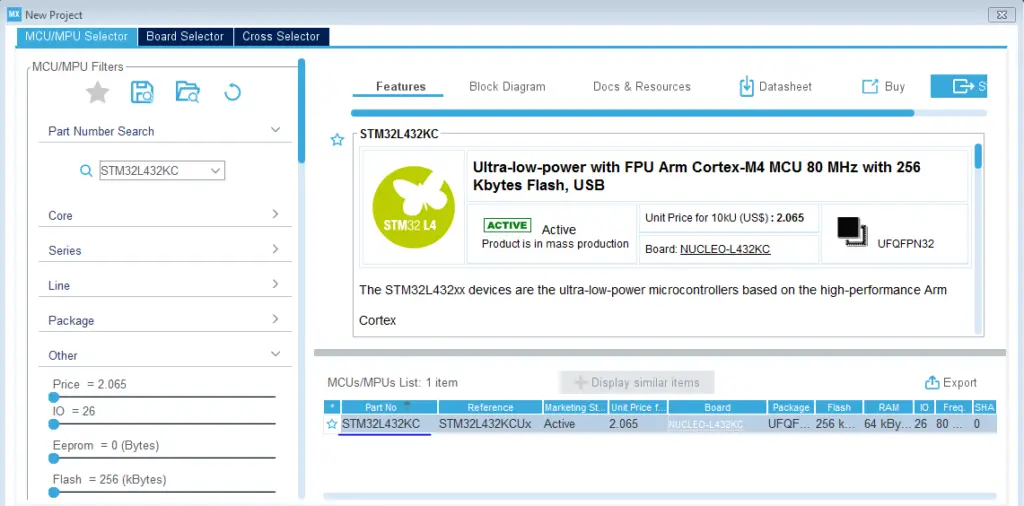
Step1: Open CubeMX & Create New Project
Step2: Choose The Target MCU & Double-Click Its Name
Step3: Configure All The Peripherals & GPIOs You’re Willing To Use In Your Project!
Whatever your project is. Just do the normal configurations as per the application. To enable the serial wire debugging, you only have to add an extra step which is the one below.
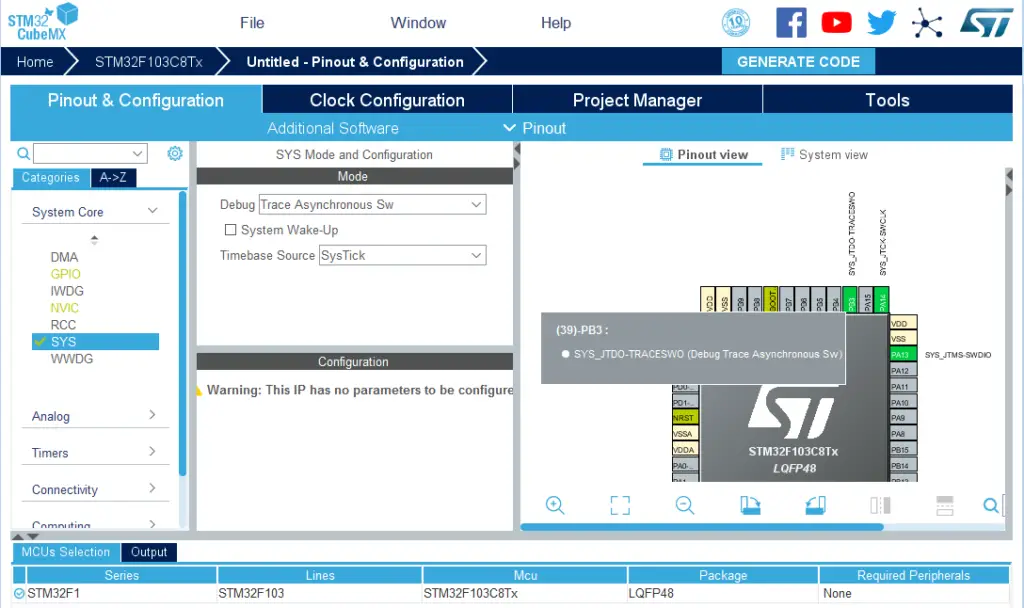
Step4: Set The Trace Serial Wire Debugging
Note: the pin B3 is now the SWO and needs to be connected to the respective pin on the ST-Link v2 debugger
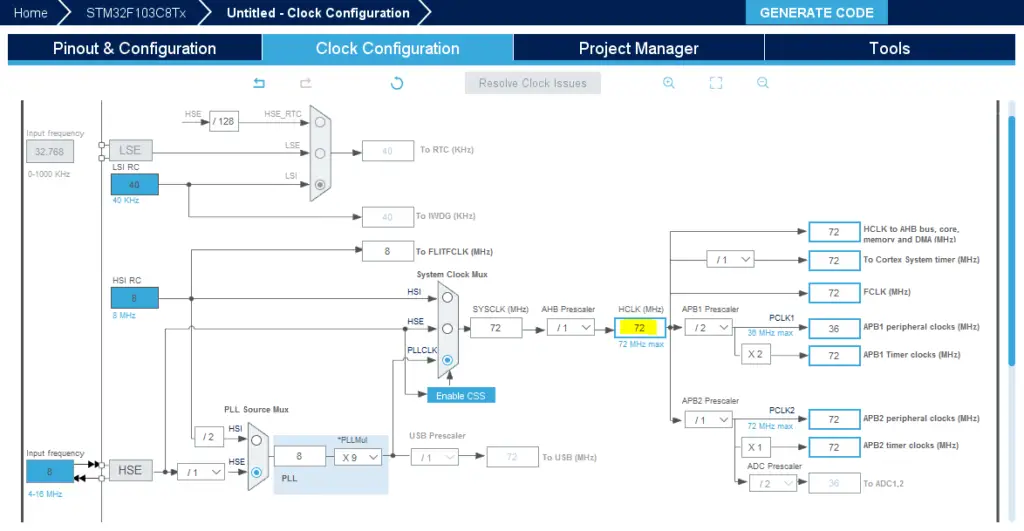
Step6: Go To The Clock Configuration
Step7: Set The System Clock To Be 72MHz Or Whatever You Want
Step8: Name & Generate The Project Initialization Code For CubeIDE or The IDE You’re Using
Then, open the project in the IDE you’re using. And head over to the main.c file.
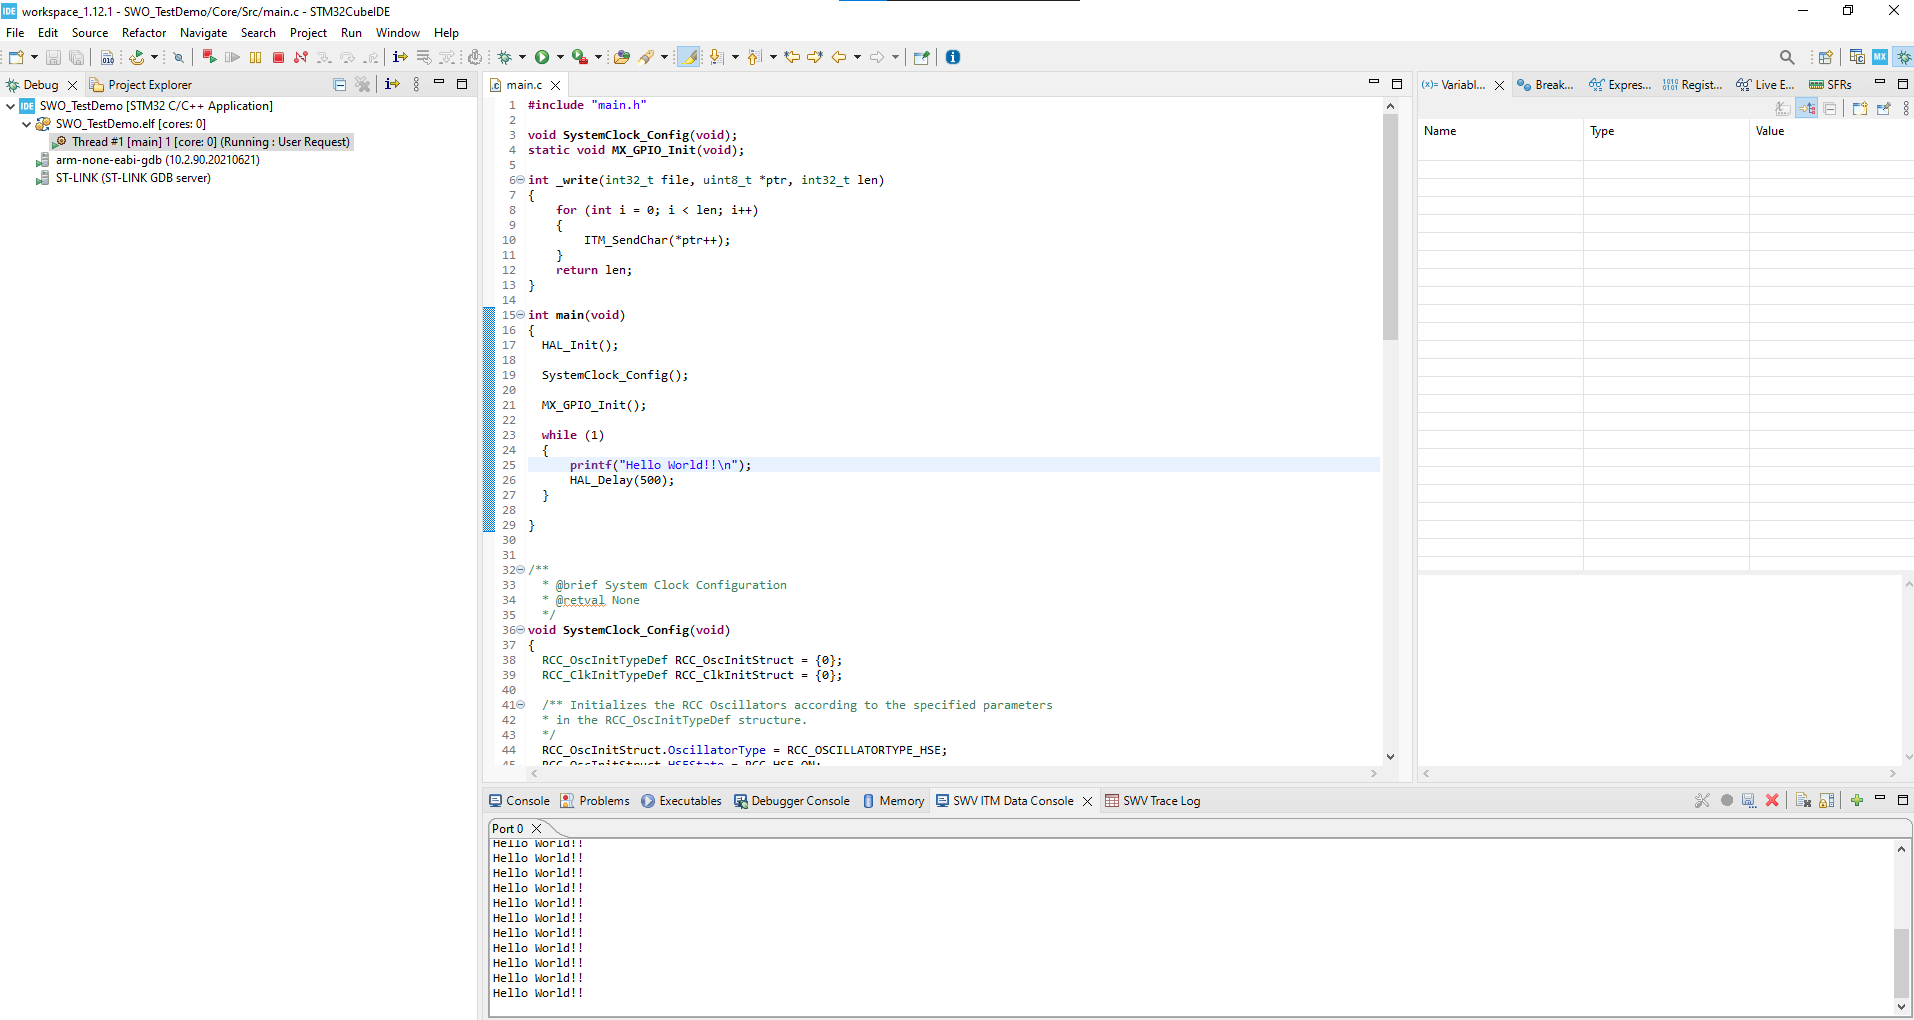
You’ll need to add this function to your main.c file before the main function. In case you’re not including the syscalls in your project yet. It gives the implementation for the printf() function so as to print the data over the ITM trace.
int_write(int32_t file,uint8_t*ptr,int32_t len) { for(inti=0;i<len;i++) { ITM_SendChar(*ptr++); } returnlen; } intmain(void) { HAL_Init(); SystemClock_Config(); MX_GPIO_Init(); while(1) { printf("Hello World!!\n"); HAL_Delay(500); } } |
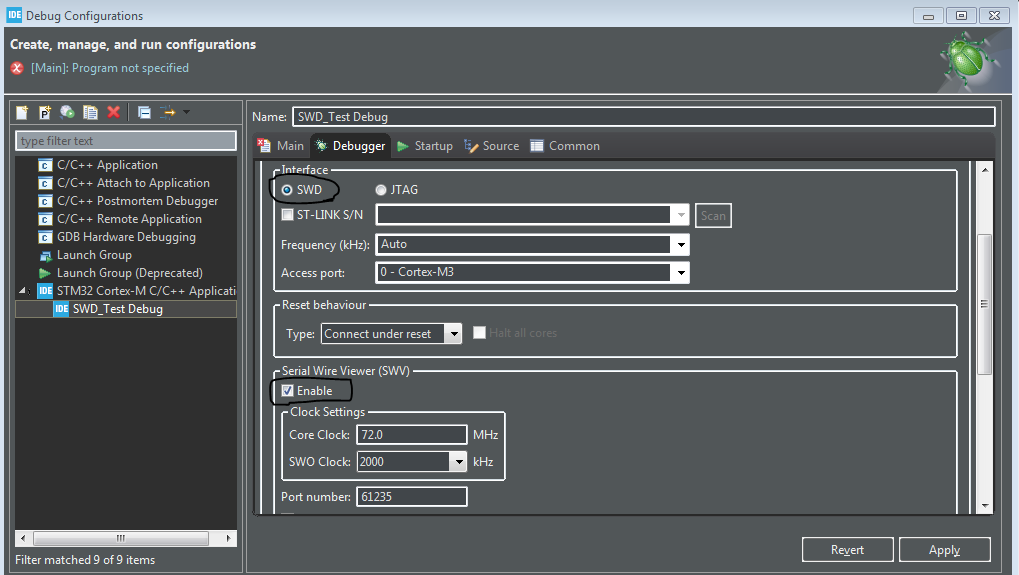
Step9: Open The Debug Configurations & Enable SWV
Step10: Build The Project & Start Debugging Session
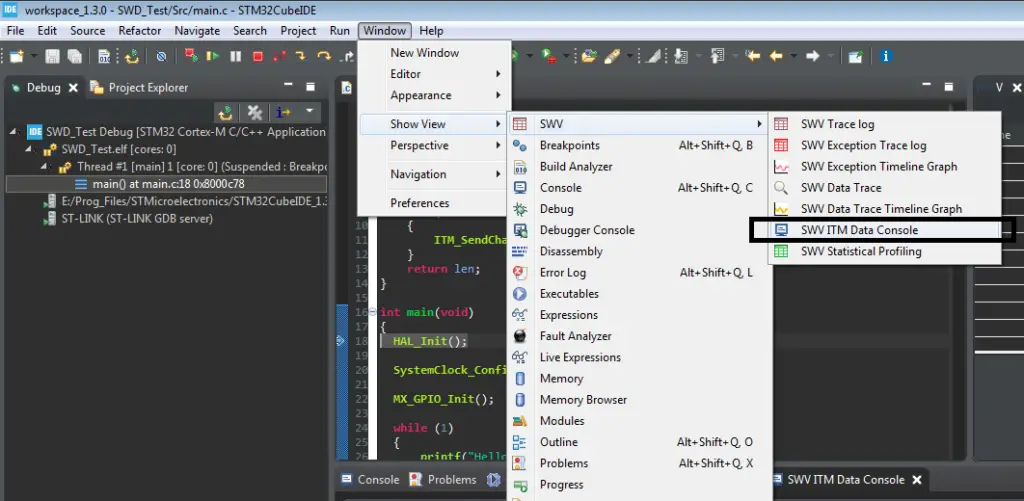
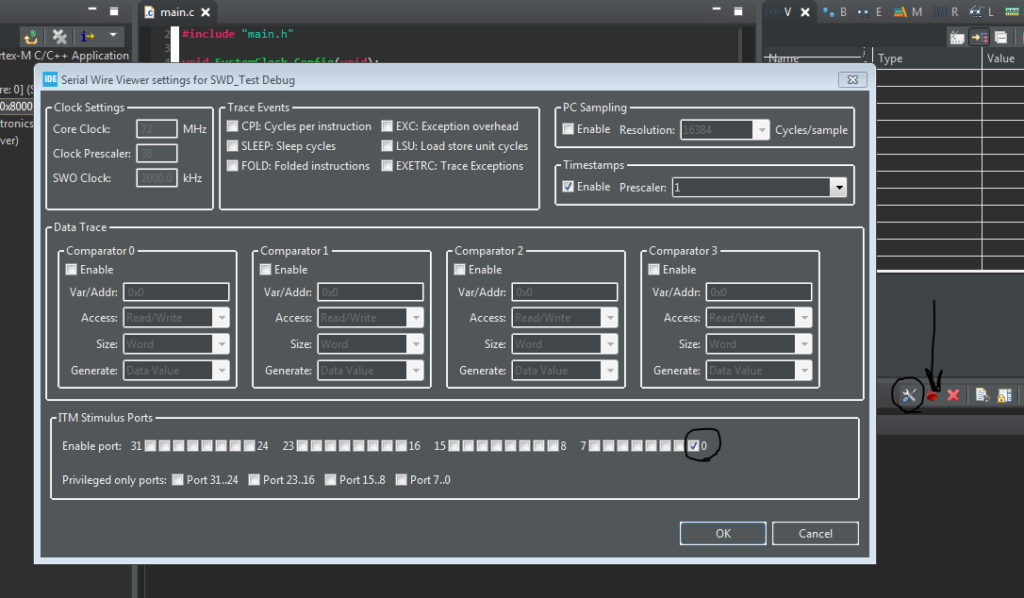
Step11: Open The SWV ITM Data Console Screen
Step12: Click The Configure Trace Button & Enable Port0 Then Click OK .. And Don’t forget to click the red button pointed to with arrow! To start the trace .. And resume the debug so the microcontroller continues printing the data
I’m not using a breakpoint in the code so it’s continuously printing the string message while running the application code in real-time with no interruption. Here is the SWV ITM Data Console View
Now, I’ve added an integer counter variable and a constant string. I did also place a BreakPoint in the main while loop just before the counter increment statement.
intmain(void) { HAL_Init(); SystemClock_Config(); MX_GPIO_Init(); intCounter=0; charMSG[]="What's UP ?!"; while(1) { Counter++; printf("Hello World!!\n"); HAL_Delay(500); } } |
Copyright ©2025. All Rights Reserved Emblab THE RAVE INNOVATION